Med-Gemini: Polygenic Risk Assessment in Modern Healthcare
Polygenic risk assessment is crucial in modern healthcare as it enables personalized medicine by estimating an individual’s genetic predisposition to various conditions or phenotypes (including disease). This approach allows for early intervention, better resource allocation in healthcare systems, and improved risk stratification when combined with traditional risk factors. It’s also important in biological research as it can discover new targets for drug development and protein design. Although important, polygenic risk scores are not deterministic, as environmental factors and lifestyle choices also influence disease development. One of the biggest caveats with polygenic scores is their limited portability between different groups of individuals (Genetic ancestry, Household income…) (1). This translates to reduced risk assesment accuracy in understudied populations, lowering the applicability of this techniques and augmenting health disparities in underrepresented groups. The classical way to calculate PGS portability involved population-level statistics (R^2) (2), these metrics although useful run into the problem of decreased PGS accuracy. The further each invididual gets from the “center” of the study population (aggregated results for all the individuals studied), the worse the risk assesment becomes. (3) . In the paper “Polygenic scoring accuracy varies across the genetic ancestry continuum”, the authors propose to move towards metrics that take into account the continuum space of genetic backgrounds present in the population. This change should obtain more accurate, robust and unbiased results.
Advances in deep learning with the advent of Transformer-Decoder architectures (Parmar et al., 2018; Vaswani et al., 2017), Multimodal modeling like PaLI (Chen et al., 2022) and improvements in multimodal understanding and reasoning have allowed researchers to train huge multimodal datasets that can take different levels and types of information to improve risk assesment. One of this examples is Med-Gemini, built on top of Gemini 1.5. Video:A good video explaining the architecture of this type of models in detail can be found in Josh Starmer’s channel Video.
Med-gemini was trained on different types of data, mostly focused around medical imaging and text reports, but today I want to focus on the way they processed and trained the model for Polygenic risk assesment based on genotype. The data for the training of this part of the model was obtained from the UK biobank project (). This project sequenced the genomes of …. people while also following the patients throughout the years, annotating different Phenotypes (diseases or traits) that the patients could present. This allowed researchers to calculate Polygenic risk scores for the different phenotypes through Genome Wide Association studies.
The way the Med-gemini team did this featurization for each individual was taking the polygenic risk scores for around 7500 of these phenotypes (melanoma, heart disease…), convert these genomic features into images (I know it sounds weird but it’s a common ocurrence in DL, most things tend to work better in the imaging space because imaging has been one of the areas where AI has had more time to develop better and better tools and it also makes it compatible with the Med-Gemini architecture). They projected the Polygenic risk scores for the 7415 traits into 8x8 pixel squares with values between [0,255] (like RGB channels). Each channel stacked different p-value thresholds, which sounds wrong, or at least my statistics professor would probably not agree with it but it seems like it’s common occurence in GWAS study due to the low power of the tests (). This featurization was then performed on 314540 samples from the UK biobank whose Genetically inferred ancestry was European (We already know why this categorical label is not the best). 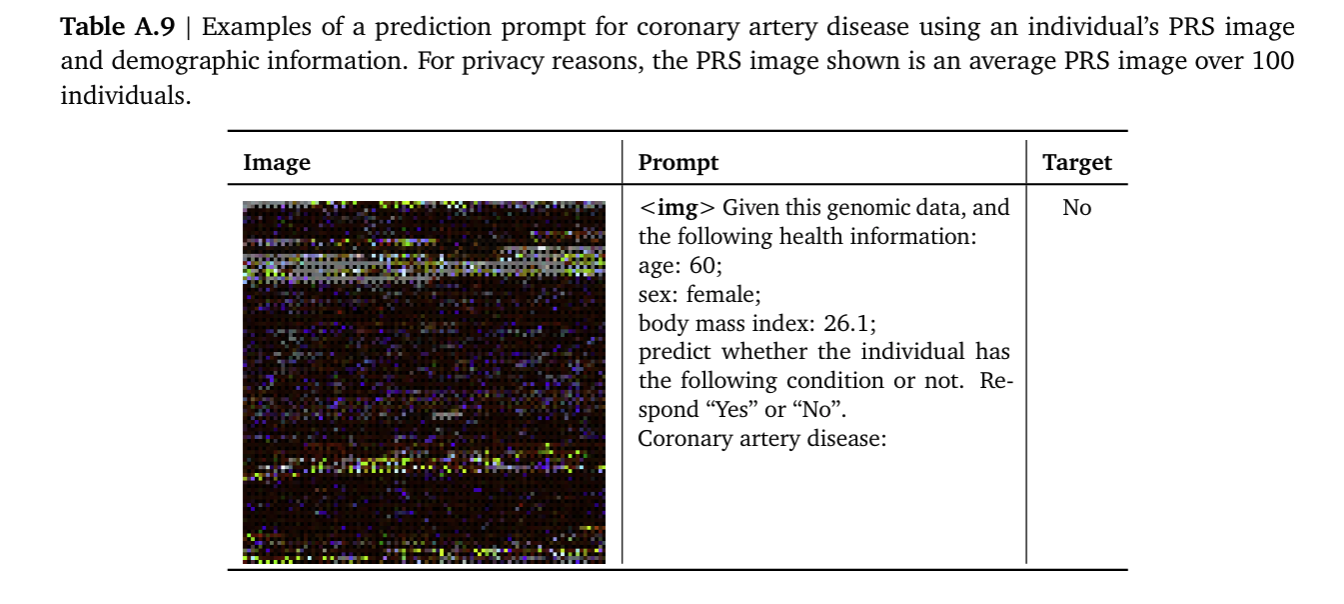
A Gemini 1.5 model was then finetuned, fine-tuning was framed as a captioning or VQA (Visual question answering) task. They basically trained the model to tell them if based on the genomic image the patient had or didn’t have the studied phenotype. The authors created benchmarks to compare this approach to the best practices in the field, this being linear models on PRS featurizations plus demographics (“Ensemble of PRSs and demographics”)(Albiñana et al., 2023; Truong et al., 2024).
The authors evaluated Med-Gemini-Polygenic performance on case/control balanced datasets sampled from the test split (200 cases, 200 controls per outcome) (They did a benchmark proving that this number is good enough when compared to bigger splits although I would have liked to see bigger datasets). The output was a disease probability score from obtained by prompting the model to predict the status of a health outcome using a text prompt and the genetic risk “image”, and computed the probability as the ratio of the likelihoods of the model generating a positive and negative prediction. Med-Gemini-Polygenic achieved higher AUCs than the PRS linear model benchmarks for all in-distribution health outcomes except glaucoma (Figure X). To evaluate zero-shot generalization ability, they prompted Med-Gemini-Polygenic to predict disease status for out-of-distribution health outcomes. They also compared this to the performance of linear probes in the model embeddings. This probes are more interpretable but the whole model performed better, probably due to non linearities in the data. The main caveat is the lack of diversity in the samples, these results need to be replicated in different cohorts. Also the explainability aspect of the model should be better studied as the stakes are really high to make decisions based on these types of models without fully understanding how they reached the diagnosis.
Glossary:
- Polygenic score: Estimates of an individual’s genetic predisposition for complex traits and diseases (that is, genetic liability; also referred to as genetic value).
- Polygenic risk score: A number that summarizes the estimated effect of many genetic variants on an individual’s phenotype, typically calculated as a weighted sum of trait-associated alleles.
- R2 test: A statistical measure (R-squared) that represents the proportion of variance in a dependent variable that’s predictable from independent variable(s). Values range from 0 to 1.
- Biobank: A large collection of biological samples and associated data, stored for research purposes. Examples include UK Biobank and FinnGen.
- Genetic distance (In paper): GD is defined as a PCA projection of the target individual on the training data used to estimate the PGS weights.
- Pearson correlation: A statistical measure that evaluates the linear relationship between two variables, ranging from -1 to +1.
- Genetically inferred ancestry (GIA): Describes the genetic similarity of an individual to a reference dataset (for example, 1000 Genomes) as inferred by methods such as principal component analysis (PCA).
- Heritability: The proportion of variation in a trait that can be attributed to genetic factors rather than environmental influences.
- Population (In genetics terms): A group of individuals of the same species living in a particular geographic area that can interbreed.
- Mixed models: Statistical models that contain both fixed effects and random effects, often used in genetics to account for population structure and relatedness.
- Relatedness: The degree of genetic similarity between individuals due to shared ancestry.
- Ancestry groupings: Classifications of individuals based on their genetic similarities and geographical origins.
- Admixture: The presence of DNA from multiple ancestral populations in an individual.
- Mahalanobis distance: A measure of distance that accounts for correlations in data and is scale-invariant.
- Upper bound metric: The theoretical maximum performance achievable by a model or method under ideal conditions.
- LDpred2: A Bayesian method for calculating polygenic scores that accounts for linkage disequilibrium between genetic variants.
- Genetic background: The complete set of genes in an organism’s genome, including their interactions.
- Credible interval: A Bayesian statistical interval that gives a range of values that likely contains the true parameter value.
- GWAS Genome Wide association study: A research method that examines genetic variants across the genome to identify associations with traits or diseases.
- Gemini: A family of large language models developed by Google, known for strong performance across various tasks.
- Gemini 1.5: An updated version of Google’s Gemini model with improved capabilities and longer context window.
- Mixture of Experts: An architecture where multiple specialized neural networks (experts) handle different aspects of input, coordinated by a gating network.
- Context window: The maximum amount of text a language model can process at once.
- Routing: The process of directing inputs to appropriate expert networks in a Mixture of Experts system.
- Contrastive learning: A machine learning approach where models learn by comparing similar and dissimilar examples, often used in self-supervised learning.
Functions described:
Correlation of an individual’s genetic liability and PGS estimate: \(r_i^2(g_i, \hat{g}_i) = \frac{\text{cov}_{\beta,D}(g_i,\hat{g}_i)^2}{\text{var}_\beta(g_i)\text{var}_{\beta,D}(\hat{g}_i)} = 1 - \frac{E_D(\text{var}_{\beta|D}(x_i^\top\beta))}{\text{var}_\beta(x_i^\top\beta)}\)
Under infinitesimal assumption for which all variants are causal and drawn from a normal distribution:
\[r_i^2(g_i, \hat{g}_i) = 1 - \frac{\sigma_\varepsilon^2 \sum_{j=1}^J \frac{1}{\lambda_j} x_i^\top v_j v_j^\top x_i}{\sigma_\beta^2 x_i^\top x_i} = 1 - \frac{\sigma_\varepsilon^2}{\sigma_\beta^2} \frac{\sum_{j=1}^J \frac{1}{\lambda_j} x_i^\top v_j v_j^\top x_i}{x_i^\top x_i}\]In which σ 2β is per single nucleotide polymorphism (SNP) heritability; σe2 is the variance of residual environmental noise; vj and λj are the jth eigenvector and eigenvalues of training genotype data and J is the total number of eigenvectors. xvvx ∑j J λ i j ji =1 1 j ⊤⊤is the squared Mahalanobis distance of the testing individual i from the centre of the training genotype data on its principal component (PC) space; and x x ii ⊤ is the sum of squared genotypes across all variants. The metric here is an upper bound of genetic prediction accuracy
References:
[^1]- Martin, A. R. et al. Clinical use of current polygenic risk scores may exacerbate health disparities. Nat. Genet. 51, 584–591 (2019). [^2]- Lambert, S. A., Abraham, G. & Inouye, M. Towards clinical utility of polygenic risk scores. Hum. Mol. Genet. 28, R133–R142 (2019). [^3]- Polygenic scoring accuracy varies across the genetic ancestry continuum [^4]- Advancing Multimodal Medical Capabilities of Gemini